Central Tendency
Important Notation
Scientific notation, while often confusing and frustrating initially, is very useful in helping to convey complex ideas in a compact and precise manner. The table below contains scientific notations relevant to this tutorial on central tendency and the next on variability.
We will be using the following notation in this class:
| Symbol | meaning |
|---|---|
| \(y\) | Dependent Variable |
| \(x\) | Independent Variable |
| \(N\) | Population size |
| \(n\) | Sample size |
| \(\Sigma\) | Sum of |
| \(\mu\) | Population mean |
| \(M\) | sample mean (also often \(\bar{x}\)) |
| \(M_w\) | Weighted mean (or \(\bar{x}_w\) ) |
| \(IQR\) | Interquartile range |
| \(\sigma^2\) | Population variance |
| \(s^2\) | sample variance |
| \(\sigma\) | Population standard deviation |
| \(s\) | sample standard deviation |
Mean
Calculating the mean
\[ \text{Population mean: } \\ \mu = \frac{\Sigma x}{N}\\ \]
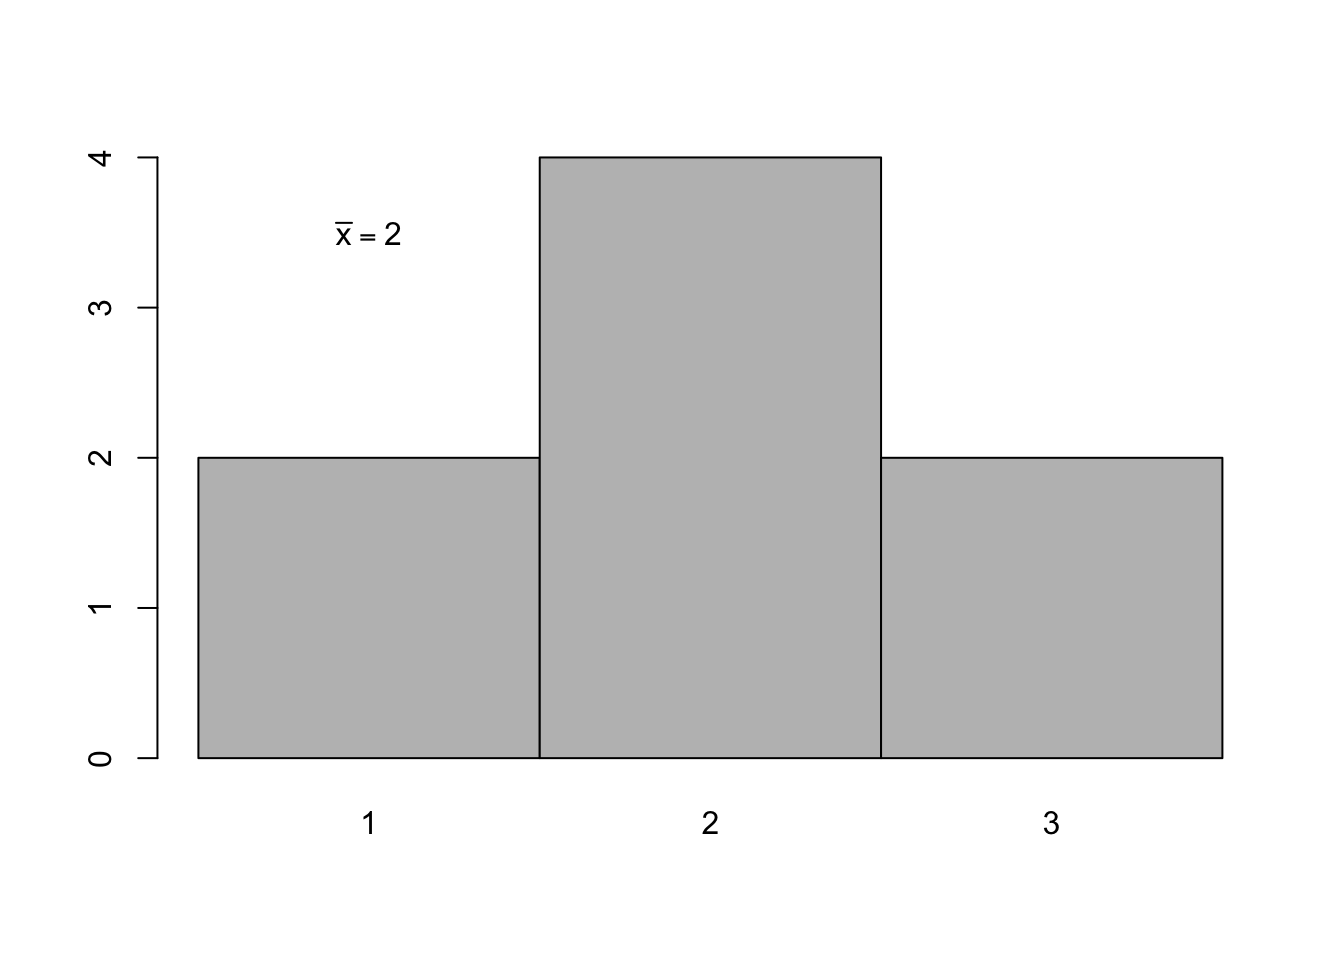
\[ \text{Sample mean: } \\ \bar{x} = \frac{\Sigma x}{n}\\ \] \(x\) = (1, 1, 2, 2, 2, 2, 3, 3)
\(n\) = 8
Calculate sample mean:
\[ \bar{x} = \frac{\Sigma x}{n} = \frac{1+1+2+2+2+2+3+3}{8} = \frac{16}{8} = 2 \]
Means summarize a distribution
Characteristics of the Mean
(from Privitera 2015)
- Changing an existing score changes the mean
- Adding a new score or removing an existing score will change the mean, unless the value of this score is equal to the mean.
- Adding, subtracting, multiplying, or dividing each score in a distribution by a constant will cause the mean to change by that constant.
- The sum of the differences of scores from their mean is zero.
- The sum of hte squared differnces of scores from their mean is minimal.
Median
The median is the middle score, with half of the scores falling above and half below this score. To calculate the median first order the values of the variable from smallest to largest. If n is odd, the median is the middle value in the sorted variable, or the value that is in the \(\frac{n + 1}{2}\) position.
If the n is even, then the median value is the average of the middle two values of the sorted variable. So, for our example variable x
\(x\) = (1, 1, 2, 2, 2, 2, 3, 3)
because \(n = 8\), we average the middle two values, which are both \(2\), so the median of \(x\) is \(2\).
Mode
The mode is the most frequent value observed in a variable.
Choosing a measure of central tendency
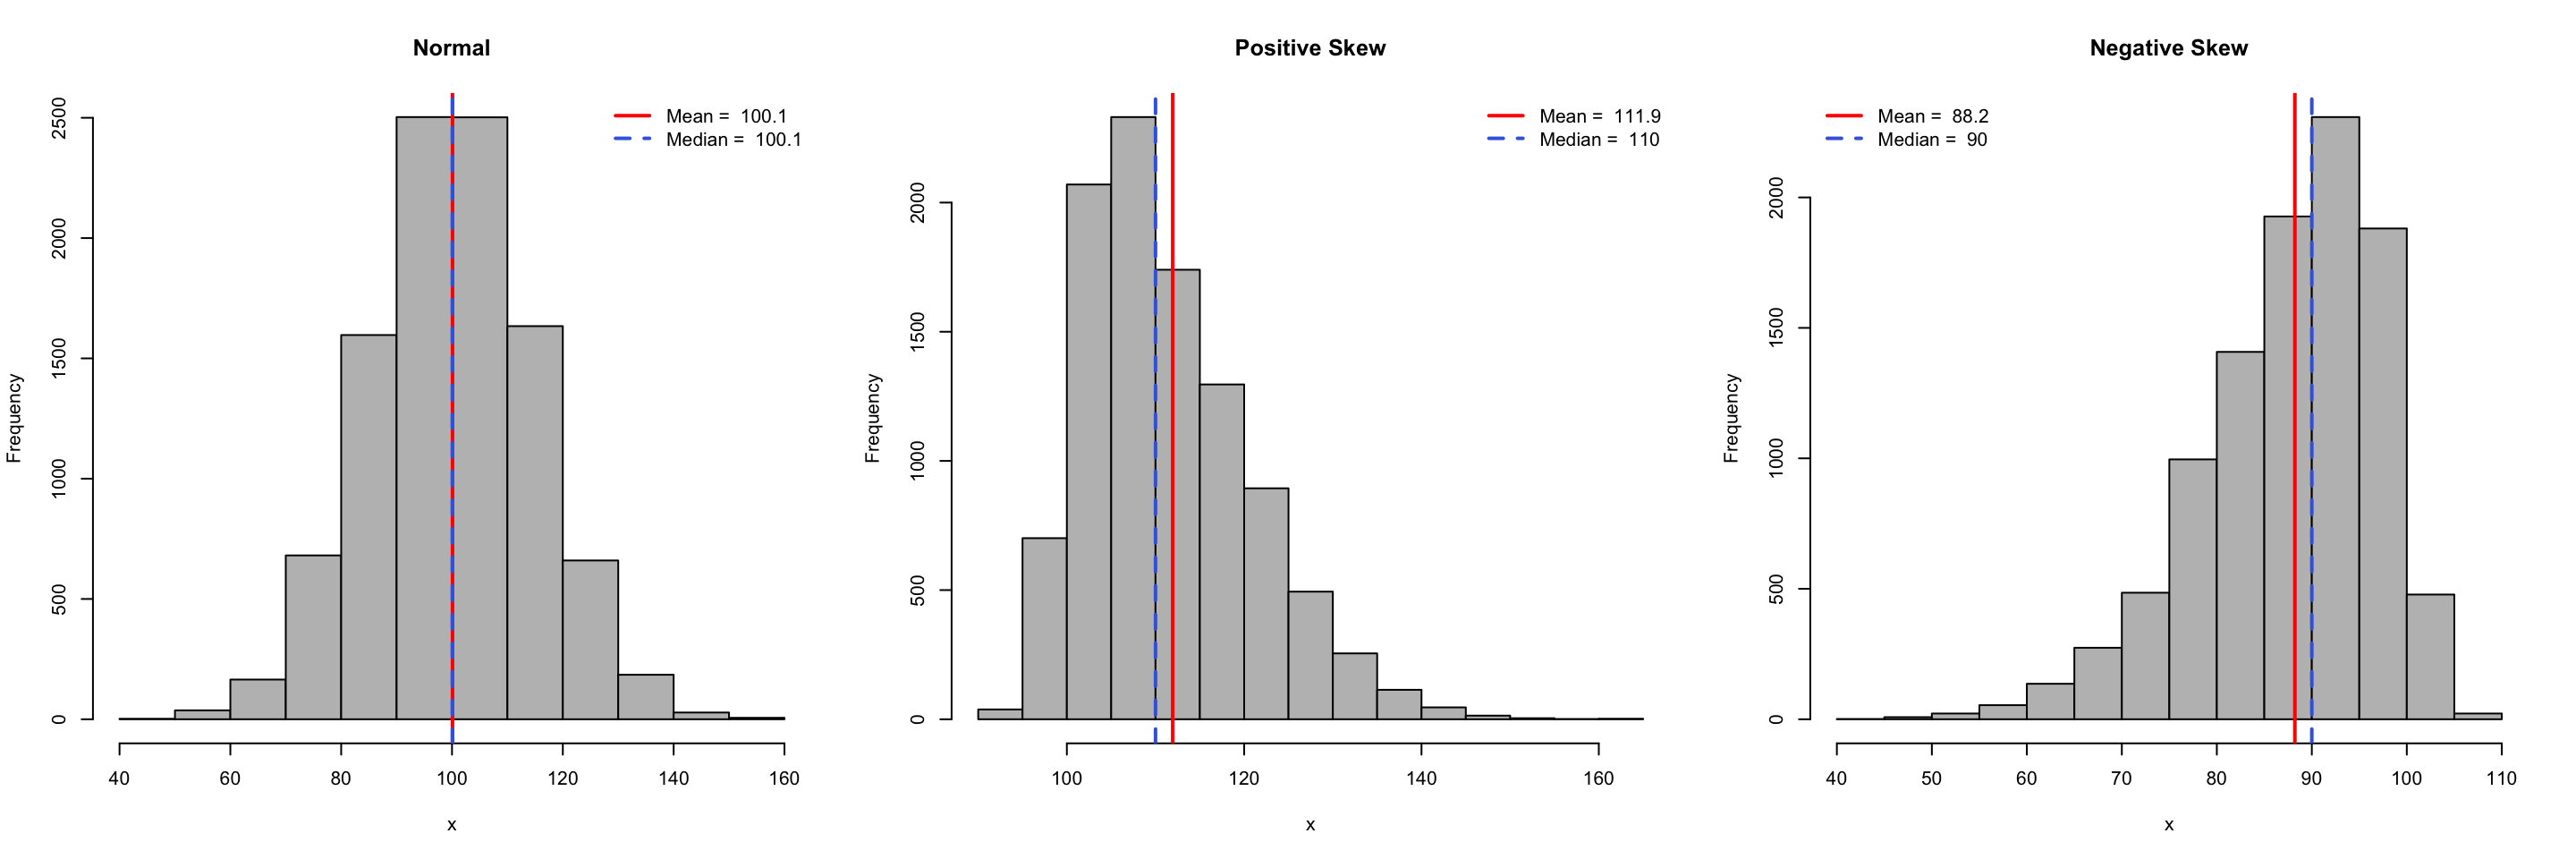
When appropriate, the mean is the preferred measure of central tendency for most applications. This is because we can do the most with the mean mathematically. Recall from what we learned about the characterisitcs of the mean that we can meaninfully add, subtract, multiply and divide means. But this depends on the type of variable we are dealing with. Generally speaking, the mean is useful for numeric variables that are symmetric in shape, preferably normally distributed. When data are skewed (i.e. not symmetrical), the mean can be adversely impacted by the skewness, being pulled toward the skewed tail moreso than the median. Therefore with skewed distributions the median can be a better measure of central tendency. The median is also less susceptable to the influence of outliers.
If three people who earn typical salaries are sitting at a bar and Bill Gates sits down beside them, the average salary at the bar just went up drastically, and doesn’t represent anyone there. But the median salary, would still be a good representation of most of the poeple at the bar.
| Central Tendency Measure | Shape of Distribution | Measurement Scale |
|---|---|---|
| Mean | Normal | Interval, ration |
| Median | Skewed | Ordinal |
| Mode | Modal | Nominal |
Note: Table based on Privitera (2015), Table 3.9, p. 90.
References
Privitera, G. J. 2015. Statistics for the Behavioral Sciences. 2nd ed. Sage Publications.